


 |
Figure 1: Achievement of Students Leaving 8th Grade in 1997 Table 1: Achievement of Students Leaving 8th Grade in 1997 Table 2: Achievement of Students Leaving Eighth Grade in 1997 by Gender Table 3: Achievement of Students Leaving Eighth Grade in 1997 by Eighth-Grade ITBS Achievement Level Table 4: Number of Graduates by School for the Class Leaving Eighth Grade in 1997 Figure 2 : Five Years of First-Year Achievement Table 5: Five Years of First-Year Achievement Table 6: Number of Students with Fs in English or Math One Year After Elementary School Table 7: 1997-1998 Achievement One Year After Elementary School by High School or APC Table 8: 2001-2002 Achievement One Year After Elementary School by High School or APC Table 9: CPS Systemwide Achievement Over Five Years Table 10: CPS Systemwide Achievement One Year After Leaving Elementary School |

This report follows Ebinger students in two ways. First, it tracks for five years members of the eighth-grade class of 1997 who enrolled in Chicago Public Schools (CPS) high schools or Academic Preparatory Centers (APCs). Second, it follows members of the eighth grade classes of 1997 to 2001 for one year to show their academic achievement during their first year after elementary school using the "on-track" indicator. The on-track indicator is important because it is strongly related to students' likelihood of graduating.
Click here for definitions of outcome and performance indicators.This report focuses on student outcomes and achievement. Outcomes include whether students graduate, drop out, or transfer out of the system. Achievement indicators show whether students are on or off track. In order for a student to be "on track" to graduate, he or she must have no more than one "F" in a core academic course and have enough credits to be promoted to the next grade.

This report tracks Ebinger students only until they graduate, drop out, or transfer out of the system. We are unable to report on those students who enroll in non-CPS high schools. We determine students' outcomes and achievement using data from the end of September of the following school year. For example, for second year students, we use information reported as they enter the fall of their third year to include any changes that might have occurred over the summer, such as earning summer school credits or dropping out.
We hope that you will use this report for both long-term planning and to strengthen your relationships with the high schools that recruit your students. The report is meant to be informative, not evaluative. Student outcomes are tracked without regard to student population. That is, the data do not adjust for any factors that might affect a school's performance such as the percentage of students who come from low income backgrounds, are eligible for special education services, or are English Language Learners.
Please note: In cases where data are missing, students are generally given the benefit of the doubt and are considered on-track. In the tables broken out by high school, if transcript data for the entire school is missing, performance is listed as unknown. Students are considered off track if they are enrolled in an APC. This report varies from a similar report published by the Consortium in 1999 in that it uses slightly different codes to measure dropping out, and includes students who left eighth grade to attend APCs.
 |
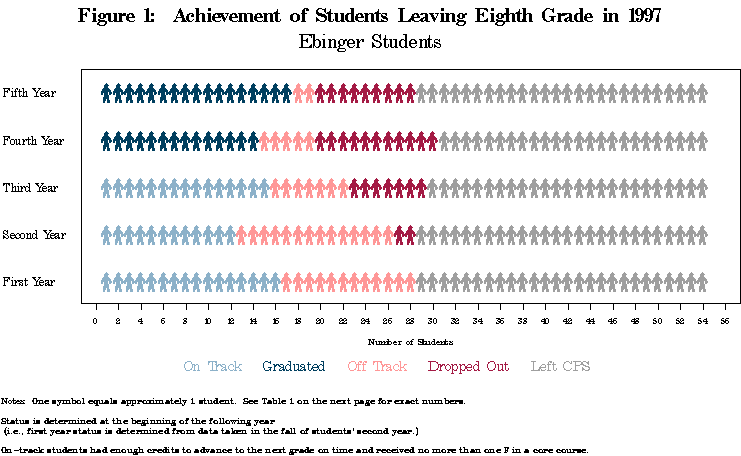
How many Ebinger students graduated from high school? Figure 1 tracks eighth graders who left Ebinger in the spring of 1997. The dark blue figures at the top left-hand corner of the figure represent the approximate number of your students who graduated from a CPS high school in five years. The exact number can be found in Table 1.
How many Ebinger students dropped out or left the system? Similarly, Figure 1 and Table 1 show how many 1997 students dropped out of school or left the system. The figures in dark red in the line labeled "Fifth Year" represent cumulative dropouts after five years. Students who dropped out after four years are represented in the line below and so on. The gray figures show how many students had transferred out of the system by the end of each year.
Did boys or girls from Ebinger have better achievement in high schools and APCs? See Table 2 to compare success over five years by gender.
How many high, middle and low-achieving students from Ebinger graduated from a CPS high school within five years? Table 3 categorizes Ebinger students from the class of 1997 based on their average eighth-grade math and reading scores on the ITBS, for students whose scores are included in reporting, and shows how the different groups performed in high school. Categories are: At or above grade level, one year or less below grade level, and more than one year below grade level.
How do the numbers of Ebinger students graduating differ from one high school to another? Table 4 shows the different high schools and APCs attended by at least three Ebinger students who left at the end of eighth grade in the spring of 1997, as well as the number who graduated from each of t hose schools within five years. (For reasons of student confidentiality, we do not report outcomes at schools with less than three Ebinger students.) Because of the importance of first year performance, students are considered graduates of the high school at which they first enrolled, not the school from which they ultimately graduated.
 |
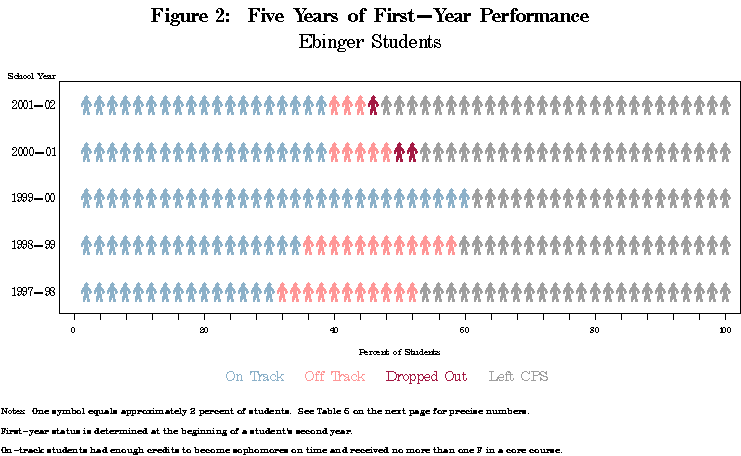
How has the number of Ebinger students on track in their first year changed over time? Figure 2 provides information about the ways successive classes of eighth graders performed their first year after leaving elementary school. Data are presented from the fall of 1997 through the fall of 2001. By comparing the number of light blue figures in each year, one can see whether more Ebinger students were on track in recent years. See Table 5 for the exact numbers. Because the number of students exiting Ebinger differs from year to year, Figure 2 shows percentages.
How many Ebinger students fail high-school level work? Table 6 shows whether Ebinger students from the classes of 1997 through 2001 were meeting high school expectations for English and math their first year. It shows the number of students that received an "F" for either semester for each of those two classes, as well as the number that received an "F" in both.
How much do Ebinger sudents' on-track rates differ from one high school to another? Table 7 shows the different high schools and APCs attended by at least three Ebinger students leaving eighth grade in the spring of 1997, as well as the number and percent of students who were on-track by the end of their first year. Table 8 shows first year success for the Ebinger students leaving in the spring of 2001. (For reasons of student confidentiality, we do not report outcomes at schools with less than three Ebinger students.)
How do CPS students achieve as a whole? Table 9 and Table 10 provide data on systemwide success for each of the eighth-grade classes from 1997 through 2001. We discourage a comparison to average CPS performance because the student population at Ebinger differs from that of the system as a whole.
Visit the Chicago Public Schools' Department of Research and Evaluation for additional test score and demographic data.

Table 1: Achievement of Students Leaving
Eighth Grade in 1997
| Students Leaving 8th Grade, Spring 1997 |
Total |
On Track |
Off Track |
Graduated |
Dropped Out |
Left CPS |
Fifth Year |
54 |
n/a |
2 |
17 |
9 |
26 |
| Fourth Year 2000-01 |
54 |
n/a |
5 |
14 |
11 |
24 |
| Third Year 1999-00 |
54 |
15 |
7 |
0 |
7 |
25 |
| Second Year 1998-99 |
54 |
12 |
14 |
n/a |
2 |
26 |
First Year |
54 |
15 |
12 |
n/a |
0 |
27 |
Table 2: Achievement of Students Leaving
Eighth Grade in 1997 by Gender
BOYS | ||||||
| Students Leaving 8th Grade, Spring 1997 |
Total |
On Track |
Off Track |
Graduated |
Dropped Out |
Left CPS |
Fifth Year |
30 |
n/a |
1 |
7 |
6 |
16 |
| Fourth Year 2000-01 |
30 |
n/a |
4 |
4 |
8 |
14 |
| Third Year 1999-00 |
30 |
6 |
6 |
0 |
4 |
14 |
| Second Year 1998-99 |
30 |
4 |
11 |
n/a |
0 |
15 |
First Year |
30 |
4 |
9 |
n/a |
0 |
17 |
GIRLS | ||||||
| Fifth Year 2001-02 |
24 |
n/a |
1 |
10 |
3 |
10 |
| Fourth Year 2000-01 |
24 |
n/a |
1 |
10 |
3 |
10 |
| Third Year 1999-00 |
24 |
9 |
1 |
0 |
3 |
11 |
| Second Year 1998-99 |
24 |
8 |
3 |
n/a |
2 |
11 |
| First Year 1997-98 |
24 |
11 |
3 |
n/a |
0 |
10 |
Table 3: Achievement of Students Leaving Eighth Grade
in 1997 by Eighth-Grade ITBS Achievement Level
STUDENTS AT OR ABOVE GRADE LEVEL | ||||||
| Students Leaving 8th Grade, Spring 1997 |
Total |
On Track |
Off Track |
Graduated |
Dropped Out |
Left CPS |
Fifth Year |
12 |
n/a |
0 |
2 |
0 |
10 |
| Fourth Year 2000-01 |
12 |
n/a |
0 |
2 |
0 |
10 |
| Third Year 1999-00 |
12 |
2 |
0 |
0 |
0 |
10 |
| Second Year 1998-99 |
12 |
2 |
0 |
n/a |
0 |
10 |
| First Year 1997-98 |
12 |
2 |
0 |
n/a |
0 |
10 |
STUDENTS LESS THAN ONE YEAR BELOW GRADE LEVEL | ||||||
Fifth Year |
17 |
n/a |
0 |
9 |
4 |
4 |
| Fourth Year 2000-01 |
17 |
n/a |
0 |
8 |
5 |
4 |
| Third Year 1999-00 |
17 |
8 |
4 |
0 |
1 |
4 |
| Second Year 1998-99 |
17 |
7 |
4 |
n/a |
1 |
5 |
First Year |
17 |
7 |
4 |
n/a |
0 |
6 |
STUDENTS MORE THAN ONE YEAR BELOW GRADE LEVEL | ||||||
Fifth Year |
12 |
n/a |
2 |
4 |
3 |
3 |
| Fourth Year 2000-01 |
12 |
n/a |
4 |
3 |
3 |
2 |
| Third Year 1999-00 |
12 |
3 |
3 |
0 |
3 |
3 |
| Second Year 1998-99 |
12 |
2 |
6 |
n/a |
1 |
3 |
| First Year 1997-98 |
12 |
3 |
5 |
n/a |
0 |
4 |
Table 4: Number of Graduates by School for the Class Leaving Eighth Grade in 1997
| High School | Number Attending |
Number Graduating within 5 Years |
| Taft | 8 |
3 |
| Roosevelt | 5 |
3 |
| Kelvyn Park | 4 |
2 |
| Foreman | 3 |
1 |
| Other CPS Schools | 9 |
6 |
Note: This table does not include students who dropped out prior to enrolling in a high school or enrolled in a non-CPS school for ninth grade, even if they return to CPS for later grades. The "Other CPS Schools" category groups students in schools with fewer than three Ebinger students. This category only exists if there were at least three such students. Students who did not graduate either left CPS, dropped out, or were still enrolled. Due to the importance of the first year of high school, students' graduation is attributed to the first high school or APC they attended.
Table 5: Five Years of First-Year Achievement
| First Year | Total |
On Track |
Off Track |
Dropped Out |
Left CPS |
| 2001-02 | 37 |
13 |
2 |
1 |
21 |
| 2000-01 | 31 |
9 |
3 |
1 |
18 |
| 1999-00 | 28 |
14 |
0 |
0 |
14 |
| 1998-99 | 38 |
13 |
9 |
0 |
16 |
| 1997-98 | 54 |
15 |
12 |
0 |
27 |
Table 6: Number of Students with Fs in English or Math
One Year after Elementary School
| First Year | Total* |
Only English |
Only Math |
English AND Math |
| 2001-02 | 15 |
0 |
2 |
0 |
| 2000-01 | 12 |
0 |
2 |
1 |
| 1999-00 | 14 |
0 |
1 |
0 |
| 1998-99 | 22 |
0 |
2 |
3 |
| 1997-98 | 27 |
3 |
1 |
3 |
Note: Total includes all students who received grades for freshman year and were on or off track. It excludes those who dropped out, left CPS, or attended charter schools.
Table 7: 1997-1998 Achievement One Year After Leaving
Elementary School by High School or APC
| High School | Number Attending |
Number On Track |
Percent On Track |
| Taft | 8 |
4 |
50.0 |
| Roosevelt | 5 |
2 |
40.0 |
| Foreman | 3 |
0 |
0.0 |
| Kelvyn Park | 3 |
2 |
66.7 |
| Other CPS Schools | 8 |
7 |
87.5 |
Note: This table does not include students who dropped out prior to enrolling in a high school. The "Other CPS Schools" category groups students in schools with fewer than three Ebinger students. This category only exists if there were at least three such students. We are unable to calculate on-track rates for charter schools, because we do not have their transcript data.
Table 8: 2001-2002 Achievement One Year After Leaving
Elementary School by High School or APC
| High School | Number Attending |
Number On Track |
Percent On Track |
| Taft | 7 |
6 |
85.7 |
| Lane Tech | 4 |
3 |
75.0 |
| Other CPS Schools | 4 |
4 |
100 |
Note: This table does not include students who dropped out prior to enrolling in a high school. The "Other CPS Schools" category groups students in schools with fewer than three Ebinger students. This category only exists if there were at least three such students. We are unable to calculate on-track rates for charter schools, because we do not have their transcript data.
Table 9: CPS Systemwide Achievement Over Five Years
|
All CPS Students Who Left 8th Grade |
Percent On Track |
Percent Off Track |
Percent |
Percent Dropped Out |
Percent Left CPS |
| Fifth Year 2001-02 |
n/a |
2.4 |
41.1 |
33.5 |
23.0 |
| Fourth Year 2000-2001 |
n/a |
7.5 |
37.8 |
32.7 |
22.1 |
| Third Year 1999-2000 |
35.0 |
19.5 |
0.2 |
24.7 |
20.6 |
| Second Year 1998-99 |
36.3 |
28.6 |
n/a |
17.0 |
18.1 |
| First Year 1997-98 |
43.3 |
31.4 |
n/a |
9.7 |
15.6 |
Table 10: CPS Systemwide Achievement One Year After Leaving Elementary School
| First Year | Percent On Track |
Percent Off Track |
Percent Dropped Out |
Percent Left CPS |
| 2001-02 | 49.6 |
28.6 |
6.4 |
15.4 |
| 2000-01 | 48.0 |
29.0 |
7.6 |
15.5 |
| 1999-00 | 47.7 |
28.3 |
8.1 |
15.9 |
| 1998-99 | 44.6 |
31.0 |
8.1 |
16.4 |
| 1997-98 | 43.3 |
31.4 |
8.1 |
17.3 |